
discrimintools.fviz_plsr#
- discrimintools.fviz_plsr(obj, element='ind', **kwargs)[source]#
-
Visualize Partial Least Squares Regression (CPLS, PLSDA, PLSLDA, PLSLOGIT)
fviz_plsrprovides plotnine based elegant visualization ofCPLS,PLSDA,PLSLDAandPLSLOGIToutputs.- Parameters:
-
obj (class) – An object of class
CPLS,PLSDA,PLSLDA,PLSLOGIT.-
element (str, default = ‘ind’) – The element to plot from the output, possible values:
‘ind’ for the individuals graphs
‘var’ for the variables graphs (= Correlation circle)
‘dist’ for the distance graphs
**kwargs – further arguments passed to or from other methods
- Returns:
-
p – A object of class ggplot.
- Return type:
-
class
See also
fviz_plsr_ind-
Visualize Partial Least Squares Regression (CPLS, PLSDA, PLSLDA, PLSLOGIT) - Graph of individuals.
fviz_plsr_var-
Visualize Partial Least Squares Regression (CPLS, PLSDA, PLSLDA, PLSLOGIT) - Graph of variables.
fviz_dist-
Visualize distance between barycenter.
Examples
>>> from discrimintools.datasets import load_dataset
>>> from discrimintools import CPLS, fviz_plsr
>>> D = load_dataset("breast") # load traning data
>>> y, X = D["Class"], D.drop(columns=["Class"]) # split into X and y
>>> clf = CPLS()
>>> clf.fit(X,y)
CPLS()
Graph of individuals…
>>> p = fviz_plsr(clf, "ind") # graph of individuals
>>> print(p)
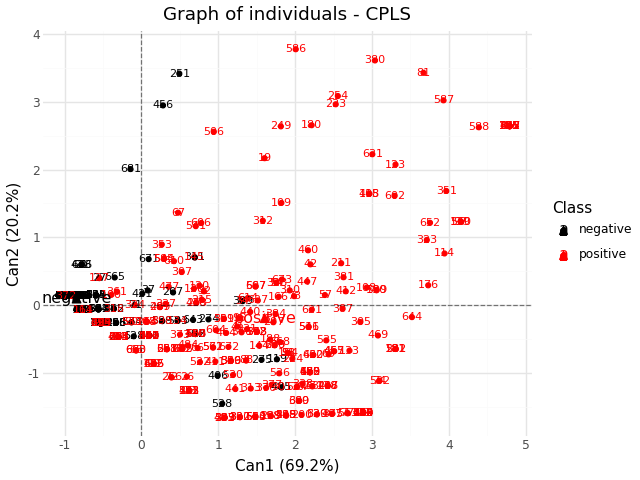
Fig. 17 Graph of individuals - CPLS#
Graph of variables…
>>> p = fviz_cpls(clf, "var") # graph of variables
>>> print(p)
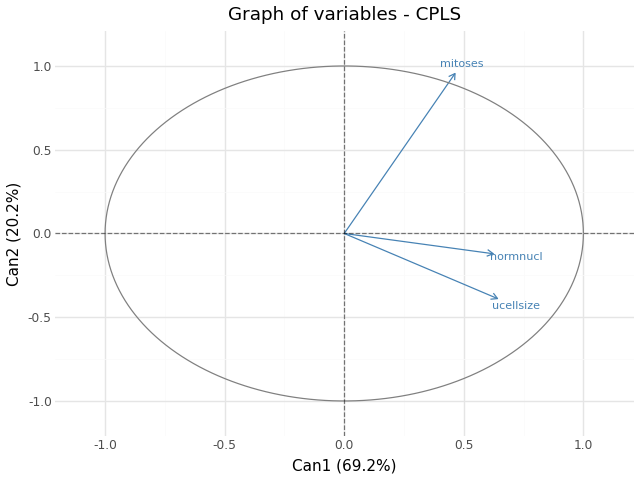
Fig. 18 Graph of variables - CPLS#
Distance between class barycenter.
>>> p = fviz_cpls(clf, "dist") # graph of distance
>>> print(p)
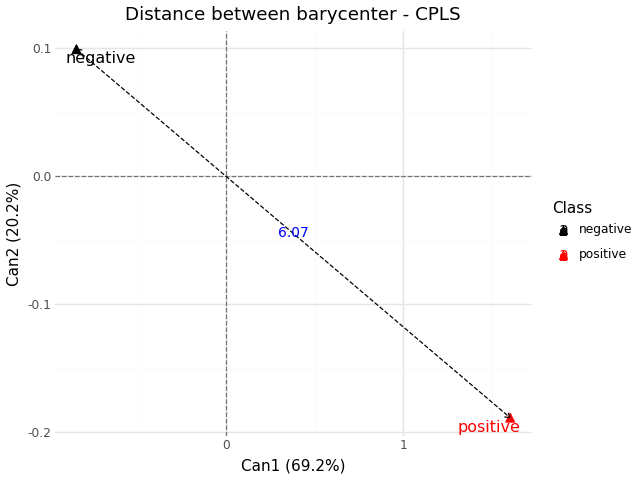
Fig. 19 Distance between barycenter - CPLS#