
discrimintools.fviz_dist#
- discrimintools.fviz_dist(obj, axis=[0, 1], geom=('point', 'text'), repel=False, point_args={'shape': '^', 'size': 3}, text_args={'size': 11.5}, palette=None, x_lim=None, y_lim=None, x_label=None, y_label=None, title=None, add_hline=True, add_vline=True, add_grid=True, ggtheme=None)[source]#
-
Visualize distance between barycenter
- Parameters:
-
obj (class) – An instance of class
CANDISC,DiCA,CPLS,PLSDA,PLSLDA,PLSLOGIT.axis (list, defaul=[0,1]) – Dimensions to be plotted
-
geom (str, list or tuple, default = (‘point’,’text’)) – Geometry to be used for the graph. Possible values are the combinaison of [“point”,”text”].
‘point’ to show only points,
‘text’ to show only labels,
(‘point’,’text’) to show both types.
repel (bool, default = False) – To avoid overplotting text labels.
point_args (dict, default = dict(shape = “o”, size = 1.5)) – Keywords arguments for geom_point.
text_args (dict, default = dict(size = 8)) – Keywords arguments for geom_text.
palette (None or list, default = None) – Color palette to be used for coloring by groups.
x_lim (None, list or tuple, default = None) – The range of the plotted
xvaluesy_lim (None, list or tuple, default = None) – The range of the plotted
yvaluesx_label (None or str, default = None) – The label text of
x.y_label (None or str, default = None) – The label text of
y.title (None or str, default = None) – The title of the graph you draw.
add_hline (bool, default = True) – To add a horizontal line.
add_vline (bool, default = True) – To add a vertical line.
add_grid (bool, default = True) – To add grid customization.
ggtheme (function, default = None) – Plotnine theme name.
- Returns:
-
p – A object of class ggplot.
- Return type:
-
class
Examples
>>> from discrimintools.datasets import load_wine
>>> from discrimintools import CANDISC, fviz_dist
>>> D = load_wine() # load training dataset
>>> y, X = D["Quality"], D.drop(columns=["Quality"]) # split into X and y
>>> clf = CANDISC()
>>> clf.fit(XTrain,yTrain)
CANDISC()
>>> p = fviz_dist(clf) # graph of distance between barycenter
>>> print(p)
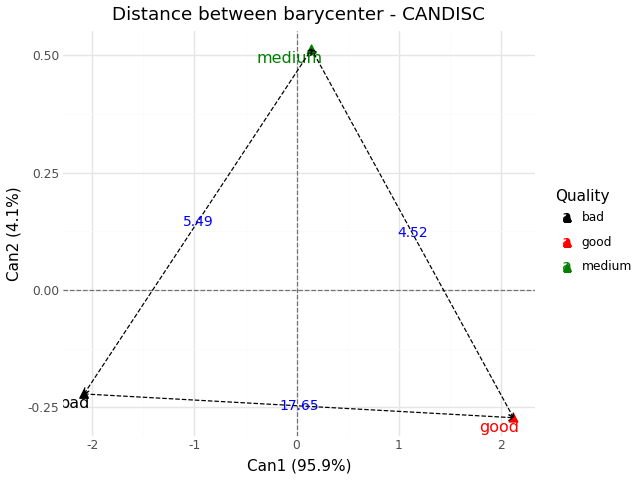
Fig. 16 Distance between barycenter - CANDISC#