
discrimintools.add_scatter#
- discrimintools.add_scatter(p, data, axis=[0, 1], geom=('point', 'text'), repel=False, color='steelblue', points_args={'shape': 'o', 'size': 1.5}, text_args={'size': 8})[source]#
-
Add elements points and/or texts to plotnine graph
- Parameters:
-
p (class) – An object of class ggplot.
data (DataFrame of shape (n_samples, n_components)) – Input data, where
n_samplesis the number of samples andn_componentsis the number of components.axis (list, defaul = [0,1]) – Dimensions to be plotted
-
geom (str, list or tuple, default=(‘point’,’text’)) – Geometry to be used for the graph. Possible values are the combinaison of [“point”,”text”].
‘point’ to show only points,
‘text’ to show only labels,
(‘point’,’text’) to show both types.
repel (bool, default=False) – To avoid overplotting text labels.
color (str, default = “steelblue”) – Color for the points and texts.
point_args (dict, default=dict(shape = “o”, size = 1.5)) – Keywords arguments for geom_point.
text_args (dict, default=dict(size = 8)) – KeywordS arguments for geom_text.
- Returns:
-
p – A object of class ggplot.
- Return type:
-
class
Examples
>>> from discrimintools.datasets import load_wine
>>> from discrimintools import CANDISC, add_scatter
>>> from plotnine import ggplot, theme_minimal
>>> D = load_wine("train") # load training dataset
>>> y, X = D["Quality"], D.drop(columns=["Quality"]) # split into X and y
>>> clf = CANDISC()
>>> clf.fit(X,y)
CANDISC()
>>> p = add_scatter(ggplot(),clf.ind_.coord,repel=True)+theme_minimal()
>>> print(p)
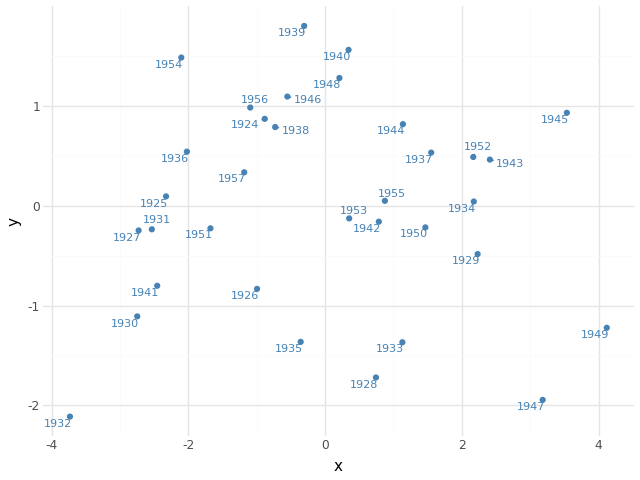
Fig. 22 Add individuals points - CANDISC#