
discrimintools.fviz_candisc_var#
- discrimintools.fviz_candisc_var(obj, axis=[0, 1], geom=('arrow', 'text'), repel=False, segment_args={'alpha': 1, 'linetype': 'solid', 'size': 0.5}, text_args={'size': 8}, palette=None, add_circle=True, col_circle='gray', x_lim=(-1.1, 1.1), y_lim=(-1.1, 1.1), x_label=None, y_label=None, title=None, add_hline=True, add_vline=True, add_grid=True, ggtheme=None)[source]#
-
Visualize Canonical Discriminant Analysis (CANDISC) - Graph of variables
Canonical discriminant analysis is a dimension-reduction technique related to principal component analysis and canonical correlation.
fviz_candisc_varprovides plotnine based elegant visualization of CANDISC outputs for variables.- Parameters:
-
obj (class) – An instance of class
CANDISC.axis (list, defaul = [0,1]) – Dimensions to be plotted
-
geom (str, list or tuple, default = (‘arrow’,’text’)) – Geometry to be used for the graph. Possible values are the combinaison of [“arrow”,”text”].
‘arrow’ to show only arrows,
‘text’ to show only labels,
(‘arrow’,’text’) to show both types.
repel (bool, default = False) – To avoid overplotting text labels.
segments_args (dict, default = dict(linetype=”solid”,size=0.5,alpha=1)) – Keywords arguments for geom_segment.
text_args (dict, default = dict(size = 8)) – Keywords arguments for geom_text.
palette (None or list, default = None) – Color palette to be used for coloring by groups.
add_circle (bool, default = True) – To draw circle.
col_circle (str, default = “gray”) – Color for the circle
x_lim (None, list or tuple, default = (-1.1,1.1)) – The range of the plotted
xvaluesy_lim (None, list or tuple, default = (-1.1,1.1)) – The range of the plotted
yvaluesx_label (None or str, default = None) – The label text of
x.y_label (None or str, default = None) – The label text of
y.title (None or str, default = None) – The title of the graph you draw.
add_hline (bool, default = True) – To add a horizontal line.
add_vline (bool, default = True) – To add a vertical line.
add_grid (bool, default = True) – To add grid customization.
ggtheme (function, default = None) – Plotnine theme name.
- Returns:
-
p – A object of class ggplot.
- Return type:
-
class
See also
fviz_candisc-
Visualize Canonical Discriminant Analysis (CANDISC).
fviz_candisc_biplot-
Visualize Canonical Discriminant Analysis (CANDISC) - Biplot of individuals and variables.
fviz_candisc_ind-
Visualize Canonical Discriminant Analysis (CANDISC) - Graph of individuals.
fviz_dist-
Visualize distance between barycenter.
Examples
>>> from discrimintools.datasets import load_wine
>>> from discrimintools import CANDISC, fviz_candisc_var
>>> D = load_wine("train") #load training data
>>> y, X = D["Quality"], D.drop(columns=["Quality"]) # split into X and y
>>> clf = CANDISC()
>>> clf.fit(X,y)
CANDISC()
>>> p = fviz_candisc_var(clf) # graph of variables
>>> print(p)
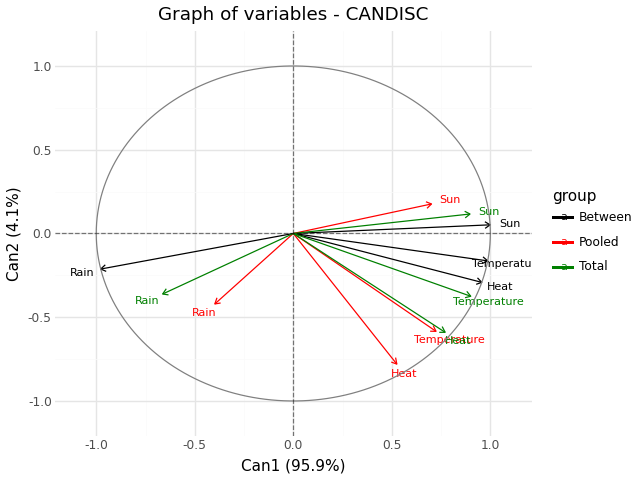
Fig. 6 Graph of variables - CANDISC#