PLSLOGIT - breast dataset#
[1]:
#disable warnings
from warnings import simplefilter, filterwarnings
simplefilter(action='ignore', category=FutureWarning)
filterwarnings("ignore")
breast dataset#
[2]:
#alcools dataset
from discrimintools.datasets import load_dataset
D = load_dataset("breast")
D.info()
<class 'pandas.core.frame.DataFrame'>
RangeIndex: 699 entries, 0 to 698
Data columns (total 4 columns):
 #   Column     Non-Null Count  Dtype
---  ------     --------------  -----
 0   ucellsize  699 non-null    int64
 1   normnucl   699 non-null    int64
 2   mitoses    699 non-null    int64
 3   Class      699 non-null    object
dtypes: int64(3), object(1)
memory usage: 22.0+ KB
[3]:
#split into X and y
y, X = D["Class"], D.drop(columns=["Class"])
Instanciation and training#
[4]:
#instanciation and training
from discrimintools import PLSLOGIT
clf = PLSLOGIT()
clf.fit(X,y)
Optimization terminated successfully.
         Current function value: 0.181262
         Iterations 8
[4]:
PLSLOGIT()In a Jupyter environment, please rerun this cell to show the HTML representation or trust the notebook.
On GitHub, the HTML representation is unable to render, please try loading this page with nbviewer.org.
Parameters
| n_components | 2 | |
| scale | True | |
| classes | None | |
| max_iter | 500 | |
| tol | 1e-10 | |
| var_select | False | |
| threshold | 1.0 | |
| multi_class | None | |
| warn_message | True |
Canonical coefficients#
[5]:
#canonical coefficients
cancoef = clf.cancoef_
cancoef._fields
[5]:
('standardized', 'raw')
Standardized canonical coefficients#
[6]:
#standardized canonical coefficients
print(cancoef.standardized)
               Can1      Can2
ucellsize  0.640964 -0.388665
normnucl   0.623278 -0.121004
mitoses    0.463204  0.954876
Raw canonical coefficients#
[7]:
#raw canonical coefficients
print(cancoef.raw)
               Can1      Can2
Constant  -1.672841 -0.372066
ucellsize  0.210051 -0.127370
normnucl   0.204110 -0.039626
mitoses    0.270077  0.556754
Coefficients#
[8]:
#coefficients
coef = clf.coef_
coef._fields
[8]:
('standardized', 'raw')
Standardized coefficients#
[9]:
#standardized coefficients
print(coef.standardized.to_frame())
           positive
const     -0.335260
ucellsize  2.319484
normnucl   2.058202
mitoses    0.727368
Raw coefficients#
[10]:
#raw coefficients
print(coef.raw)
Constant    -5.324298
ucellsize    0.760123
normnucl     0.674017
mitoses      0.424102
Name: positive, dtype: float64
Summary#
[11]:
#summary
from discrimintools import summaryPLSLOGIT
summaryPLSLOGIT(clf,detailed=True)
                     Partial Least Squares Logistic Regression - Results

Class Level Information:
          Frequency  Proportion  Prior Probability
negative        458      0.6552             0.6552
positive        241      0.3448             0.3448

Importance of PLS components:
      Proportion (%)  Cumulative (%)
Can1         69.1520         69.1520
Can2         20.1981         89.3501

Raw Canonical Coefficients:
             Can1    Can2
Constant  -1.6728 -0.3721
ucellsize  0.2101 -0.1274
normnucl   0.2041 -0.0396
mitoses    0.2701  0.5568

PLS Logistic Regression Coefficients:
           positive
Constant    -5.3243
ucellsize    0.7601
normnucl     0.6740
mitoses      0.4241

Classification Summary for Calibration Data:

Observation Profile:
                        Read  Used
Number of Observations   699   699

Number of Observations Classified into Class:
prediction  negative  positive  Total
Class
negative         441        17    458
positive          25       216    241
Total            466       233    699

Percent Classified into Class:
prediction  negative  positive  Total
Class
negative     96.2882    3.7118  100.0
positive     10.3734   89.6266  100.0
Total        66.6667   33.3333  100.0
Priors        0.6552    0.3448    NaN

Error Count Estimates for Class:
        negative  positive   Total
Rate      0.0371    0.1037  0.0601
Priors    0.6552    0.3448     NaN

Classification Report for Class:
              precision  recall  f1-score   support
negative         0.9464  0.9629    0.9545  458.0000
positive         0.9270  0.8963    0.9114  241.0000
accuracy         0.9399  0.9399    0.9399    0.9399
macro avg        0.9367  0.9296    0.9330  699.0000
weighted avg     0.9397  0.9399    0.9397  699.0000
Plotting#
[12]:
#plotting
from discrimintools import fviz_plsr
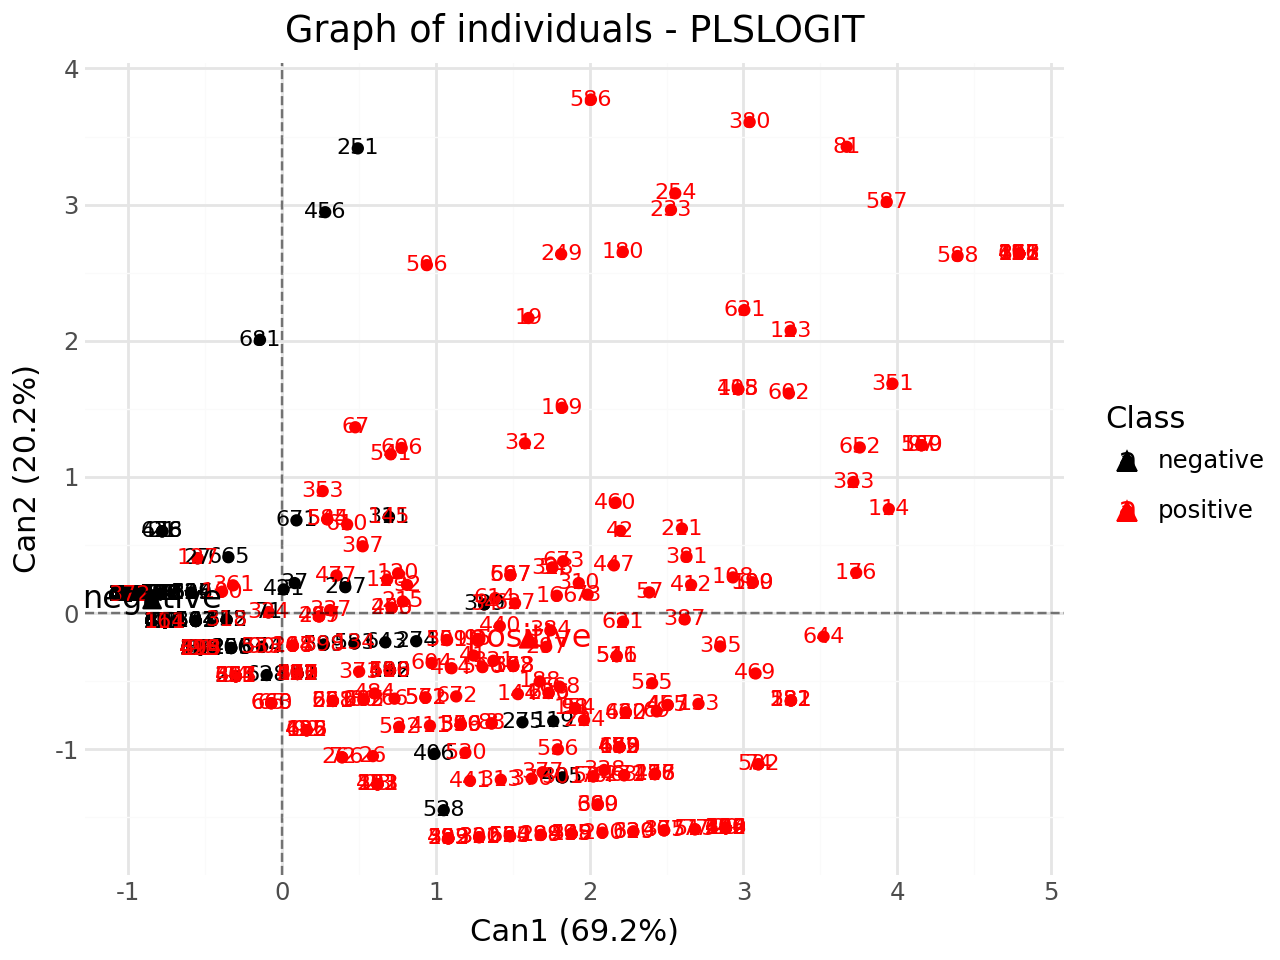
Graph of individuals#
[13]:
#graph of individuals
p = fviz_plsr(clf,element="ind",repel=False)
p.show()
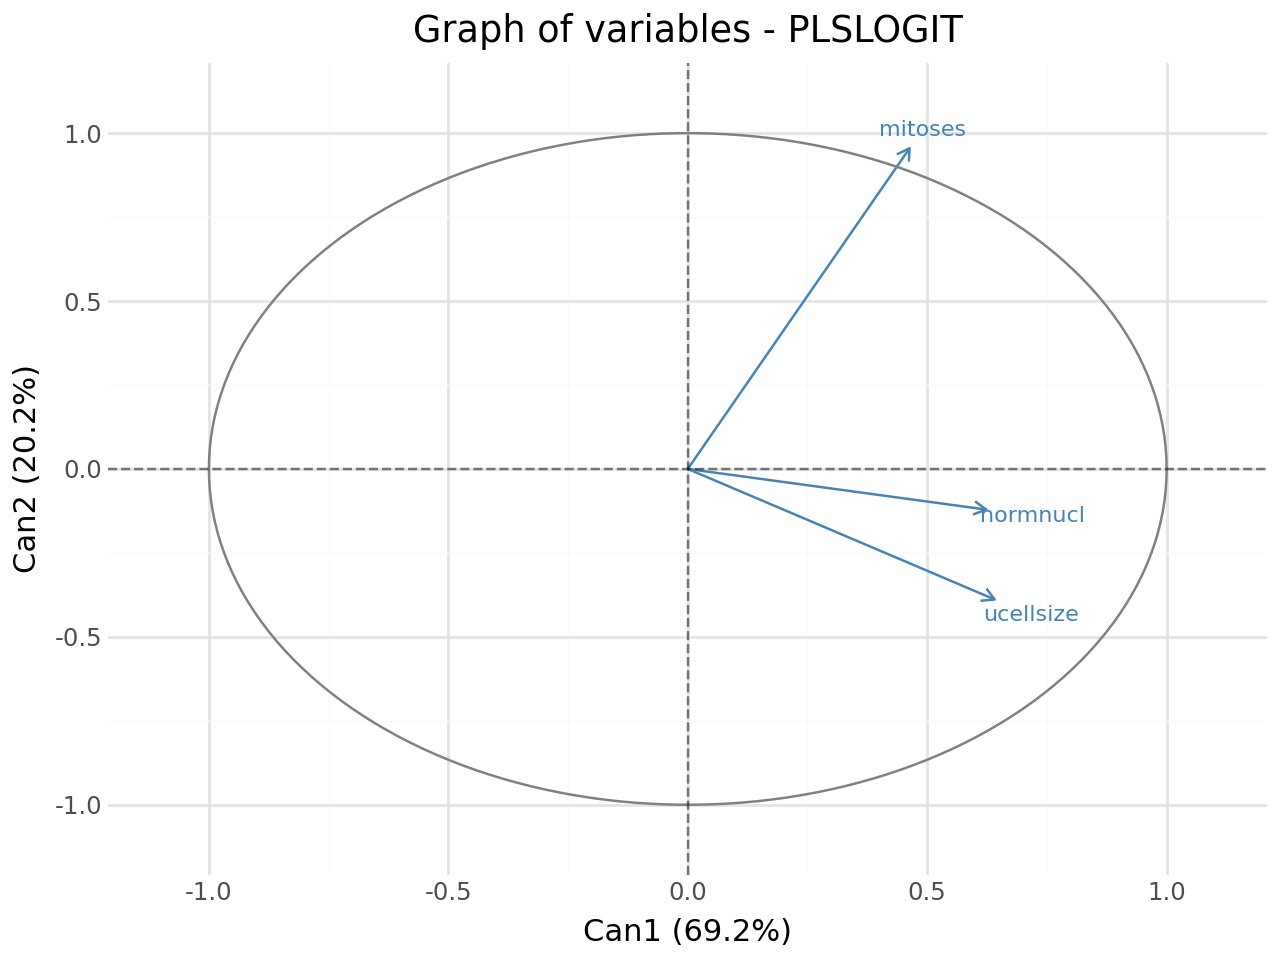
Graph of variables#
[14]:
#graph of variables
p = fviz_plsr(clf,element="var",repel=True)
p.show()
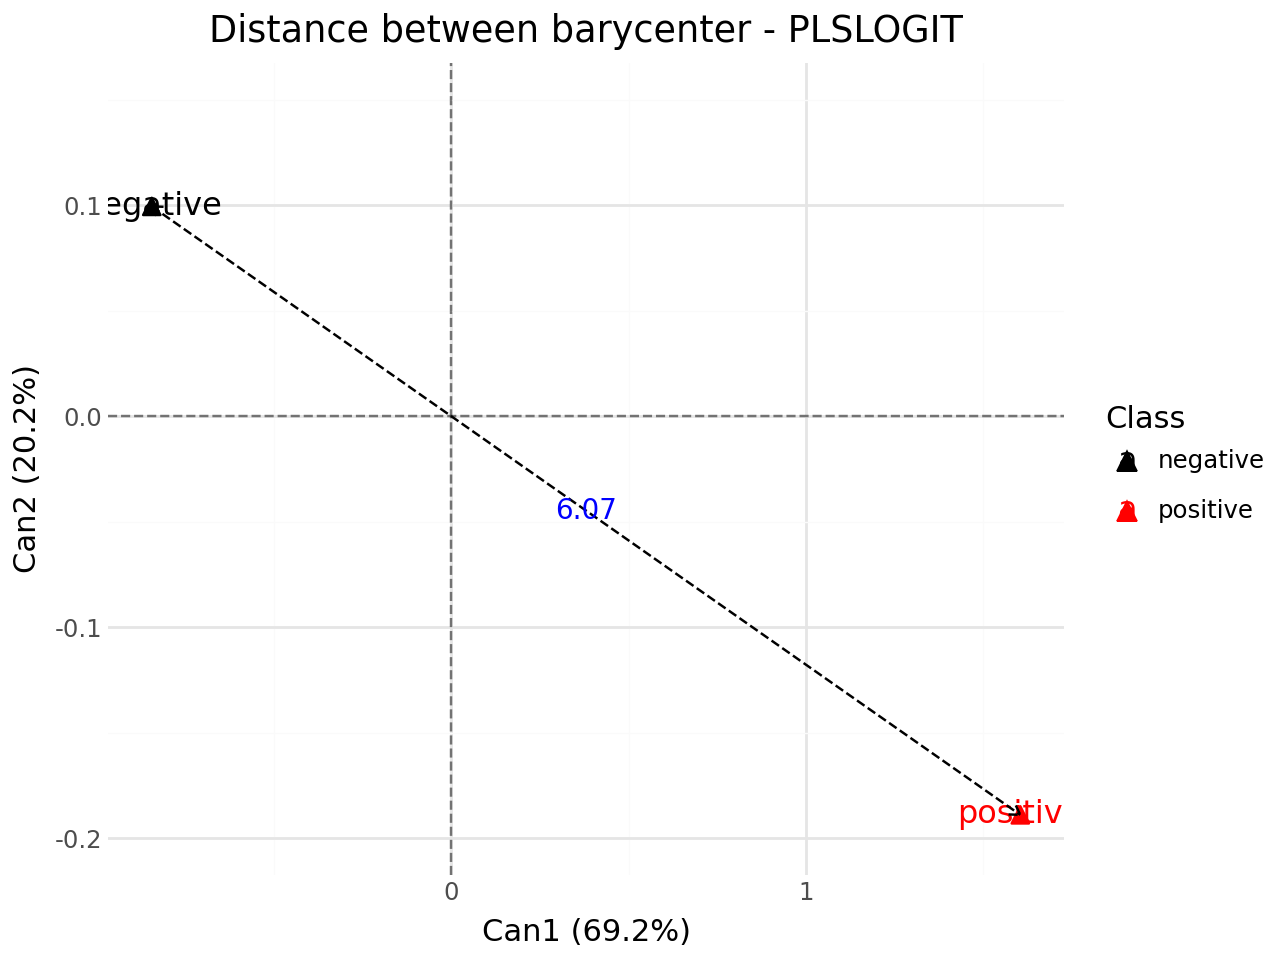
Distance between barycenter#
[15]:
#distance between barycenter
p = fviz_plsr(clf,element="dist",repel=False,y_lim=(-0.2,0.15))
p.show()