CANDISC - oliveoil dataset#
[1]:
#disable warnings
from warnings import simplefilter, filterwarnings
simplefilter(action='ignore', category=FutureWarning)
filterwarnings("ignore")
oliveoil dataset#
[2]:
#vins dataset
from discrimintools.datasets import load_oliveoil
D = load_oliveoil()
print(D.info())
<class 'pandas.core.frame.DataFrame'>
RangeIndex: 569 entries, 0 to 568
Data columns (total 9 columns):
 #   Column       Non-Null Count  Dtype
---  ------       --------------  -----
 0   CLASSE       569 non-null    object
 1   palmitic     569 non-null    int64
 2   palmitoleic  569 non-null    int64
 3   stearic      569 non-null    int64
 4   oleic        569 non-null    int64
 5   linoleic     569 non-null    int64
 6   linolenic    569 non-null    int64
 7   arachidic    569 non-null    int64
 8   eicosenoic   569 non-null    int64
dtypes: int64(8), object(1)
memory usage: 40.1+ KB
None
[3]:
#split into X and y
y, X = D["CLASSE"], D.drop(columns=["CLASSE"])
instanciation and training#
[4]:
from discrimintools import CANDISC
clf = CANDISC(n_components=2)
clf.fit(X,y)
[4]:
CANDISC()In a Jupyter environment, please rerun this cell to show the HTML representation or trust the notebook.
On GitHub, the HTML representation is unable to render, please try loading this page with nbviewer.org.
Parameters
| n_components | 2 | |
| classes | None | |
| warn_message | True |
eval_predict function#
[5]:
#eval_predict function
eval_train = clf.eval_predict(X,y,verbose=True)
Observation Profile:
                        Read  Used
Number of Observations   569   569

Number of Observations Classified into CLASSE:
prediction    Centre_North  Sardinia  South  Total
CLASSE
Centre_North           146         4      0    150
Sardinia                 0        97      0     97
South                    1         0    321    322
Total                  147       101    321    569

Percent Classified into CLASSE:
prediction    Centre_North    Sardinia      South  Total
CLASSE
Centre_North     97.333333    2.666667   0.000000  100.0
Sardinia          0.000000  100.000000   0.000000  100.0
South             0.310559    0.000000  99.689441  100.0
Total            25.834798   17.750439  56.414763  100.0
Priors            0.263620    0.170475   0.565905    NaN

Error Count Estimates for CLASSE:
        Centre_North  Sardinia     South     Total
Rate        0.026667  0.000000  0.003106  0.008787
Priors      0.263620  0.170475  0.565905       NaN

Classification Report for CLASSE:
              precision    recall  f1-score     support
Centre_North   0.993197  0.973333  0.983165  150.000000
Sardinia       0.960396  1.000000  0.979798   97.000000
South          1.000000  0.996894  0.998445  322.000000
accuracy       0.991213  0.991213  0.991213    0.991213
macro avg      0.984531  0.990076  0.987136  569.000000
weighted avg   0.991455  0.991213  0.991238  569.000000
score function#
[6]:
#score function
print("Accuracy : {}%".format(100*round(clf.score(X,y),2)))
Accuracy : 99.0%
[7]:
#error rate
print("Error rate : {}%".format(100-100*round(clf.score(X,y),2)))
Error rate : 1.0%
summary#
[8]:
from discrimintools import summaryCANDISC
Simple summary#
[9]:
#simple summary
summaryCANDISC(clf)
                     Canonical Discriminant Analysis - Results

Summary Information:
               infos  Value                  DF  DF value
0  Total Sample Size    569            DF Total       568
1          Variables      8   DF Within Classes       566
2            Classes      3  DF Between Classes         2

Class Level Information:
              Frequency  Proportion  Prior Probability
Centre_North        150      0.2636             0.2636
Sardinia             97      0.1705             0.1705
South               322      0.5659             0.5659

Total-Sample Class Means:
             Centre_North   Sardinia      South
palmitic        1094.8333  1112.0619  1332.3696
palmitoleic       83.8933    96.3505   154.8882
stearic          231.0400   226.3505   228.7081
oleic           7791.9733  7266.9072  7099.5311
linoleic         727.8800  1197.3608  1034.0093
linolenic         21.7467    27.0103    38.0373
arachidic         37.5467    73.0000    63.1025
eicosenoic         1.9733     1.9278    27.3323

Importance of components:
      Eigenvalue  Difference  Proportion  Cumulative
Can1      8.4718      6.1684     78.6232     78.6232
Can2      2.3034         NaN     21.3768    100.0000

Raw Canonical and Classification Functions Coefficients:
                Can1     Can2  Centre_North  Sardinia    South
Constant    -13.0646 -56.9169      -70.0899  194.6549 -37.1812
palmitic      0.0028   0.0089        0.0072   -0.0344   0.0070
palmitoleic   0.0131   0.0184       -0.0095   -0.0959   0.0333
stearic      -0.0028   0.0043        0.0171   -0.0029  -0.0071
oleic         0.0006   0.0062        0.0094   -0.0199   0.0016
linoleic      0.0011  -0.0013       -0.0061   -0.0001   0.0029
linolenic     0.0411   0.0058       -0.1257   -0.1523   0.1045
arachidic    -0.0173  -0.0347       -0.0063    0.1565  -0.0442
eicosenoic    0.1631   0.0101       -0.5231   -0.5673   0.4146
Detailed summary#
[10]:
#detailed summary
summaryCANDISC(clf,detailed=True)
                     Canonical Discriminant Analysis - Results

Summary Information:
               infos  Value                  DF  DF value
0  Total Sample Size    569            DF Total       568
1          Variables      8   DF Within Classes       566
2            Classes      3  DF Between Classes         2

Class Level Information:
              Frequency  Proportion  Prior Probability
Centre_North        150      0.2636             0.2636
Sardinia             97      0.1705             0.1705
South               322      0.5659             0.5659

Total-Sample Class Means:
             Centre_North   Sardinia      South
palmitic        1094.8333  1112.0619  1332.3696
palmitoleic       83.8933    96.3505   154.8882
stearic          231.0400   226.3505   228.7081
oleic           7791.9733  7266.9072  7099.5311
linoleic         727.8800  1197.3608  1034.0093
linolenic         21.7467    27.0103    38.0373
arachidic         37.5467    73.0000    63.1025
eicosenoic         1.9733     1.9278    27.3323

Importance of components:
      Eigenvalue  Difference  Proportion  Cumulative
Can1      8.4718      6.1684     78.6232     78.6232
Can2      2.3034         NaN     21.3768    100.0000

Raw Canonical and Classification Functions Coefficients:
                Can1     Can2  Centre_North  Sardinia    South
Constant    -13.0646 -56.9169      -70.0899  194.6549 -37.1812
palmitic      0.0028   0.0089        0.0072   -0.0344   0.0070
palmitoleic   0.0131   0.0184       -0.0095   -0.0959   0.0333
stearic      -0.0028   0.0043        0.0171   -0.0029  -0.0071
oleic         0.0006   0.0062        0.0094   -0.0199   0.0016
linoleic      0.0011  -0.0013       -0.0061   -0.0001   0.0029
linolenic     0.0411   0.0058       -0.1257   -0.1523   0.1045
arachidic    -0.0173  -0.0347       -0.0063    0.1565  -0.0442
eicosenoic    0.1631   0.0101       -0.5231   -0.5673   0.4146

Test of H0: The canonical correlations in the current row and all that follow are zero
   Canonical Correlation  Squared Canonical Correlation  Likelihood Ratio  \
0                 0.9457                         0.8944            0.0320
1                 0.8350                         0.6973            0.3027

   Approximate F value  Num DF  Den DF  Pr>F  Chi-Square  DF  Pr>Chi2
0             320.9837      16    1118   0.0   1936.8430  16      0.0
1             184.2721       7     560   0.0    672.1608   7      0.0

Classification Summary for Calibration Data:

Observation Profile:
                        Read  Used
Number of Observations   569   569

Number of Observations Classified into CLASSE:
prediction    Centre_North  Sardinia  South  Total
CLASSE
Centre_North           146         4      0    150
Sardinia                 0        97      0     97
South                    1         0    321    322
Total                  147       101    321    569

Percent Classified into CLASSE:
prediction    Centre_North  Sardinia    South  Total
CLASSE
Centre_North       97.3333    2.6667   0.0000  100.0
Sardinia            0.0000  100.0000   0.0000  100.0
South               0.3106    0.0000  99.6894  100.0
Total              25.8348   17.7504  56.4148  100.0
Priors              0.2636    0.1705   0.5659    NaN

Error Count Estimates for CLASSE:
        Centre_North  Sardinia   South   Total
Rate          0.0267    0.0000  0.0031  0.0088
Priors        0.2636    0.1705  0.5659     NaN

Classification Report for CLASSE:
              precision  recall  f1-score   support
Centre_North     0.9932  0.9733    0.9832  150.0000
Sardinia         0.9604  1.0000    0.9798   97.0000
South            1.0000  0.9969    0.9984  322.0000
accuracy         0.9912  0.9912    0.9912    0.9912
macro avg        0.9845  0.9901    0.9871  569.0000
weighted avg     0.9915  0.9912    0.9912  569.0000
Evaluation of prediction on testing dataset#
Testing data#
[11]:
#testining data
DTest = load_oliveoil("test")
print(DTest.info())
<class 'pandas.core.frame.DataFrame'>
RangeIndex: 3 entries, 0 to 2
Data columns (total 9 columns):
 #   Column       Non-Null Count  Dtype
---  ------       --------------  -----
 0   CLASSE       3 non-null      object
 1   palmitic     3 non-null      int64
 2   palmitoleic  3 non-null      int64
 3   stearic      3 non-null      int64
 4   oleic        3 non-null      int64
 5   linoleic     3 non-null      int64
 6   linolenic    3 non-null      int64
 7   arachidic    3 non-null      int64
 8   eicosenoic   3 non-null      int64
dtypes: int64(8), object(1)
memory usage: 344.0+ bytes
None
[12]:
#display
print(DTest)
         CLASSE  palmitic  palmitoleic  stearic  oleic  linoleic  linolenic  \
0      Sardinia      1042          135      210   7376      1116         35
1  Centre_North      1090           60      195   7955       600         28
2         South      1306          127      250   7254       869         47

   arachidic  eicosenoic
0         90           3
1         42           2
2         68          24
[13]:
#display into X and y
yTest, XTest = DTest["CLASSE"], DTest.drop(columns=["CLASSE"])
#eval_predict function
eval_test = clf.eval_predict(XTest,yTest,verbose=True)
Observation Profile:
                        Read  Used
Number of Observations     3     3

Number of Observations Classified into CLASSE:
prediction    Centre_North  Sardinia  South  Total
CLASSE
Centre_North             1         0      0      1
Sardinia                 0         1      0      1
South                    0         0      1      1
Total                    1         1      1      3

Percent Classified into CLASSE:
prediction    Centre_North    Sardinia       South  Total
CLASSE
Centre_North    100.000000    0.000000    0.000000  100.0
Sardinia          0.000000  100.000000    0.000000  100.0
South             0.000000    0.000000  100.000000  100.0
Total            33.333333   33.333333   33.333333  100.0
Priors            0.263620    0.170475    0.565905    NaN

Error Count Estimates for CLASSE:
        Centre_North  Sardinia     South  Total
Rate         0.00000  0.000000  0.000000    0.0
Priors       0.26362  0.170475  0.565905    NaN

Classification Report for CLASSE:
              precision  recall  f1-score  support
Centre_North        1.0     1.0       1.0      1.0
Sardinia            1.0     1.0       1.0      1.0
South               1.0     1.0       1.0      1.0
accuracy            1.0     1.0       1.0      1.0
macro avg           1.0     1.0       1.0      3.0
weighted avg        1.0     1.0       1.0      3.0
Plotting functions#
[14]:
#plotting
from discrimintools import fviz_candisc
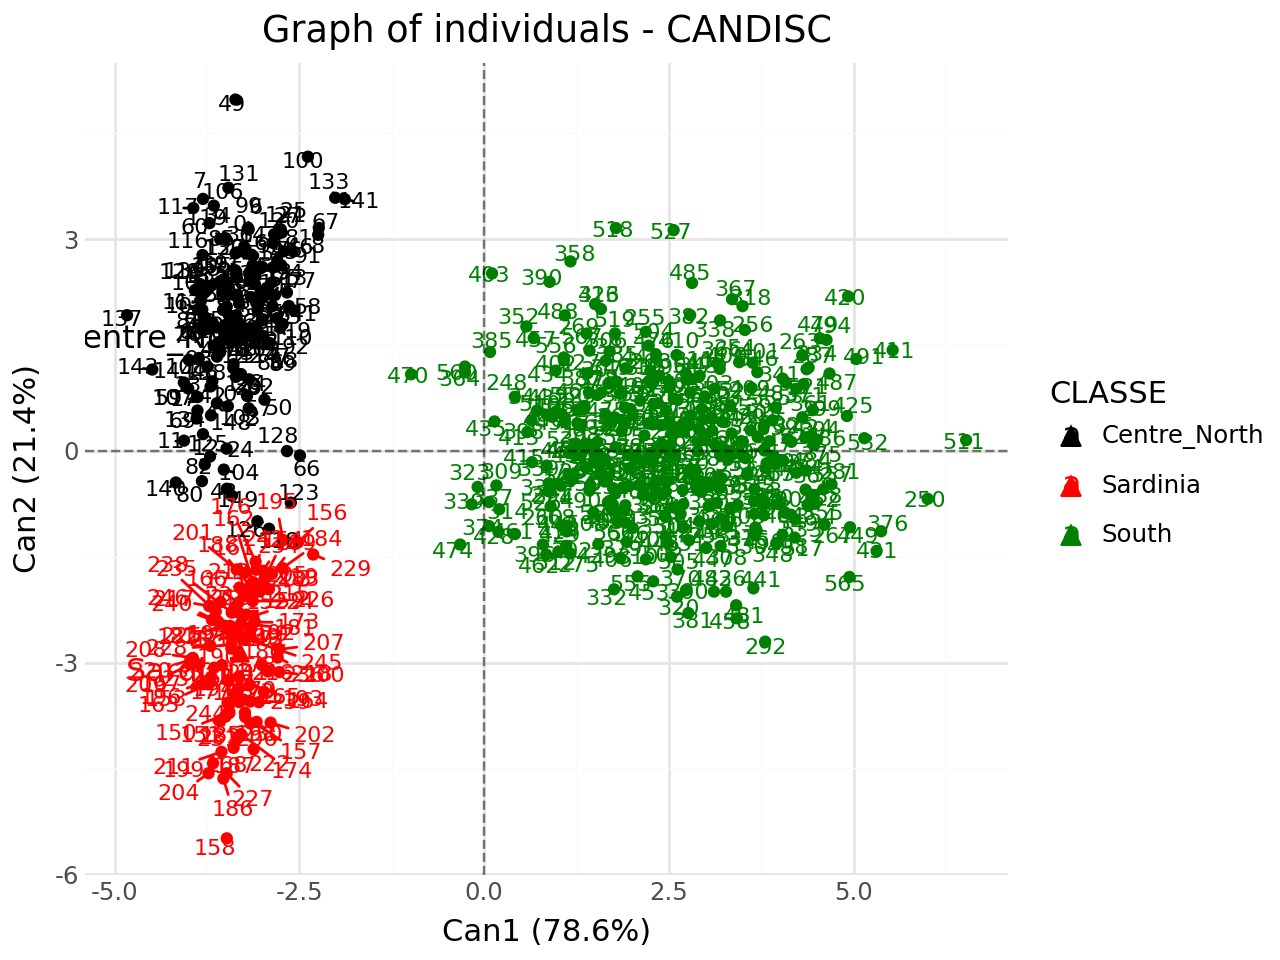
Graph of individuals#
[15]:
#graph of individuals
p = fviz_candisc(clf,element="ind",repel=True)
p.show()
We add supplementary individuals to initial plot.
[16]:
#with supplementary individuals
from discrimintools import add_scatter
p = add_scatter(p,clf.transform(XTest),color="blue",repel=True)
p.show()

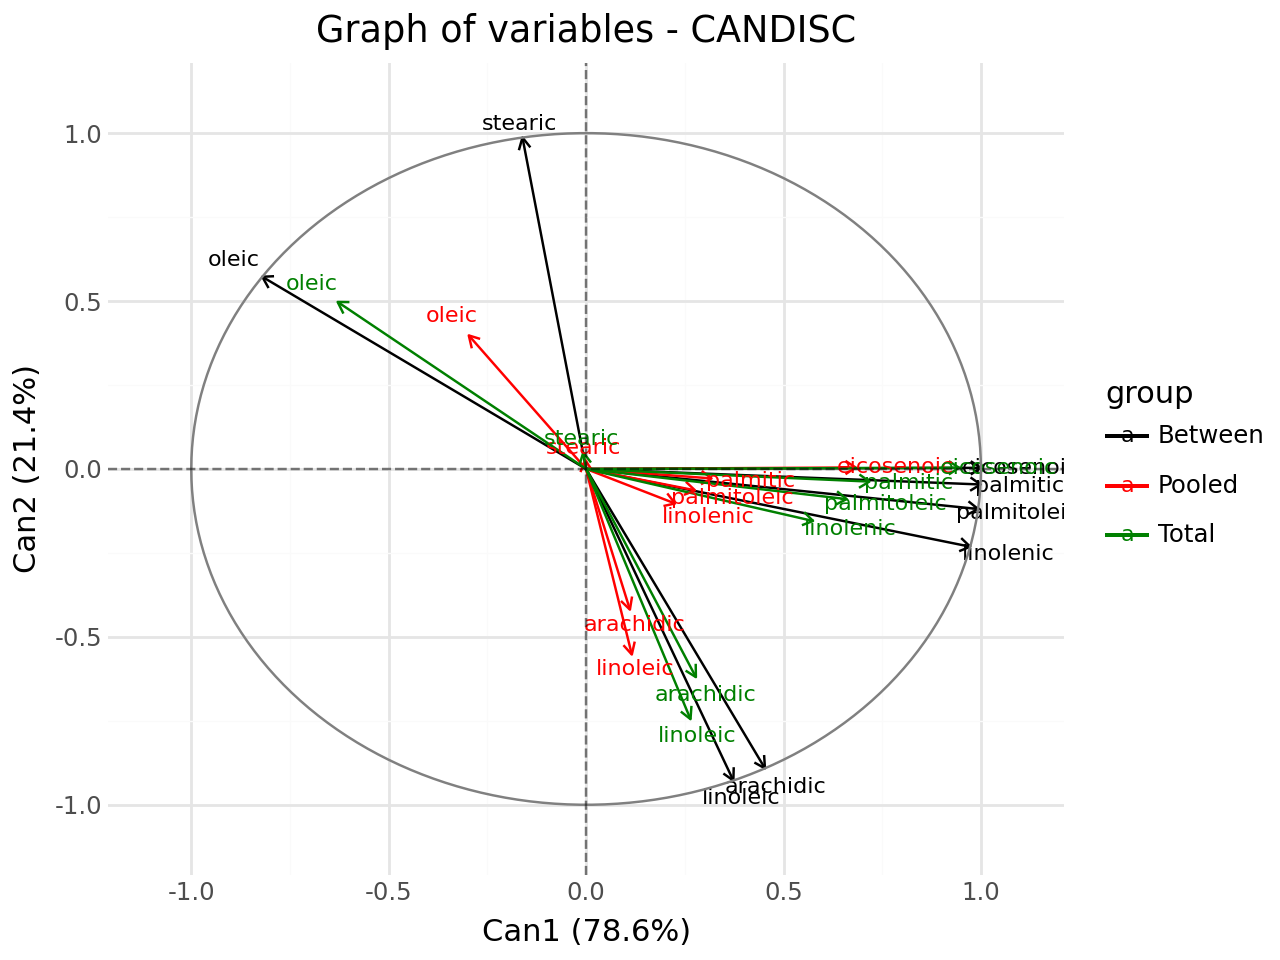
Graph of variables#
[17]:
#graph of variables
fviz_candisc(clf,element="var",repel=True).show()
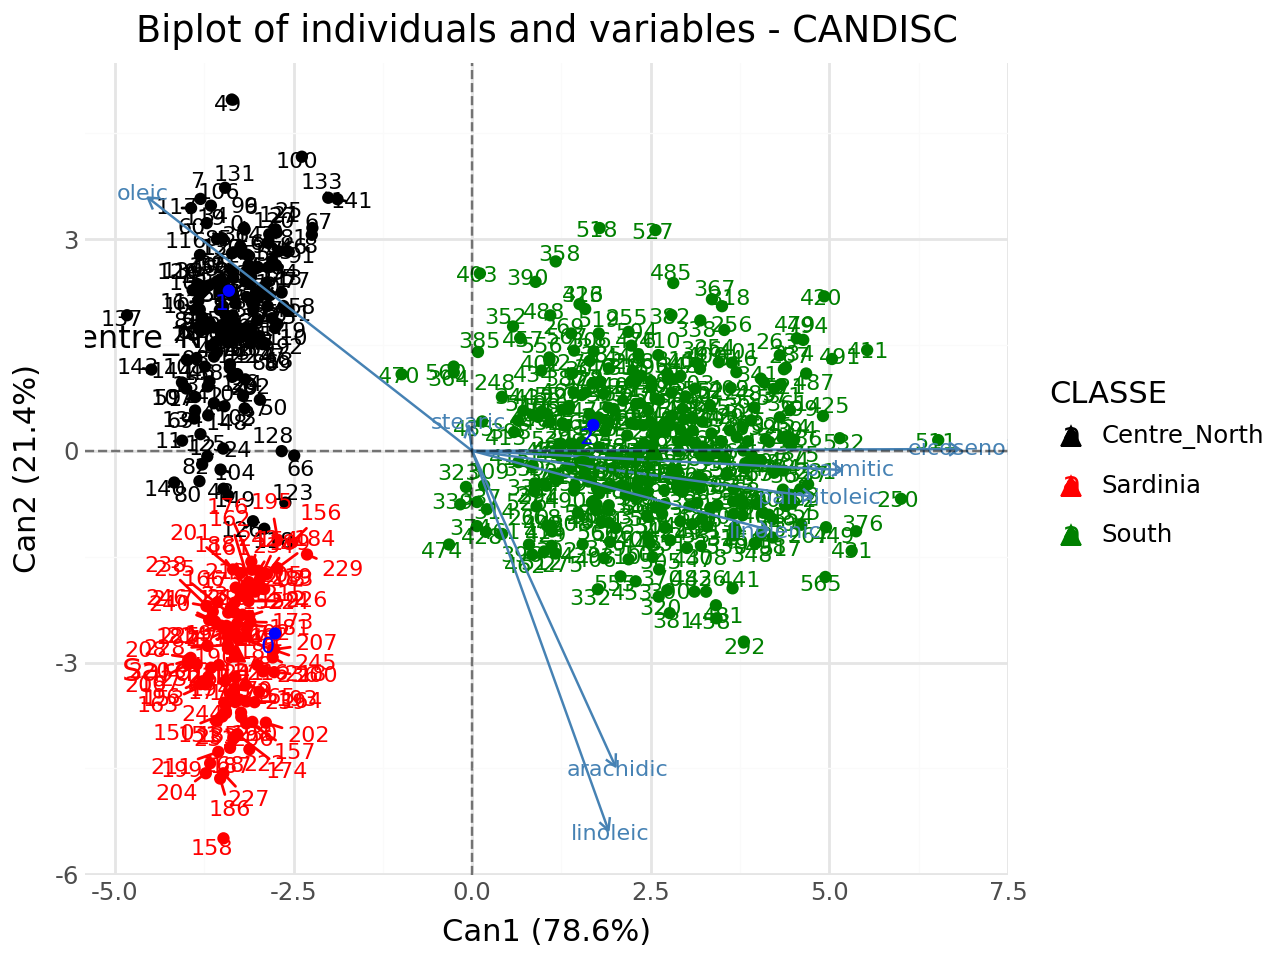
Biplot of individuals and variables#
[18]:
#biplot of individuals and variables
p = fviz_candisc(clf,element="biplot",repel=True)
#add supplementary individuals
p = add_scatter(p,clf.transform(XTest),color="blue",repel=True)
p.show()
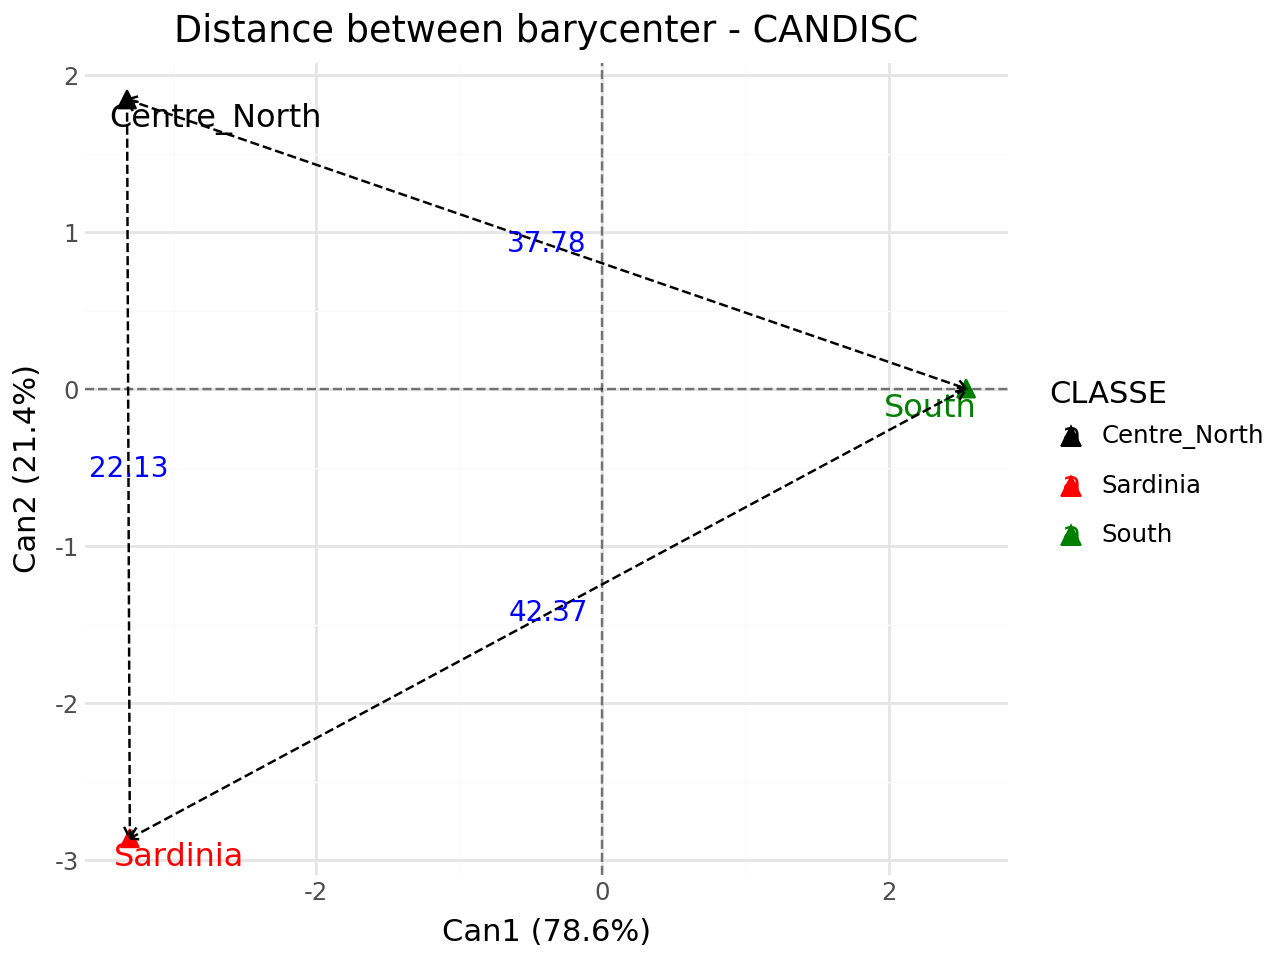
Distance between barycenter#
[19]:
#distance between barycenter
fviz_candisc(clf,element="dist",repel=True).show()